epraya.Eresonant#
- Eresonant(Hamer, Expe, graph=True, table=True, relevance=1e-4, Mcolor=True)#
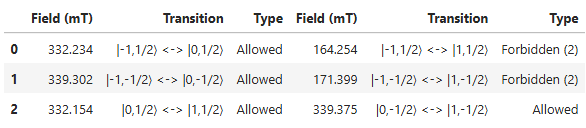
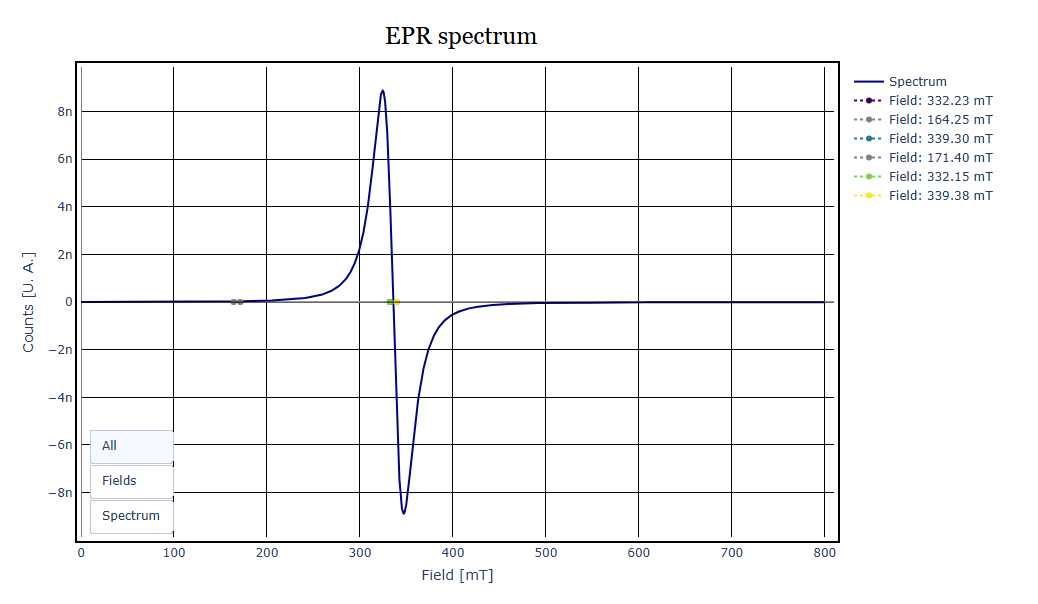
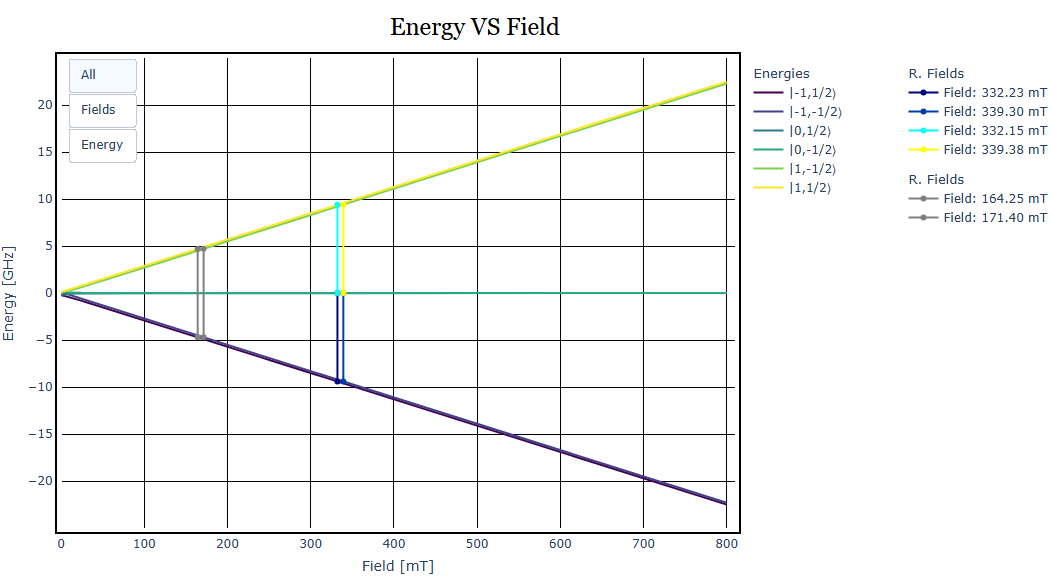
Function for the simulation of the EPR spectrum for monocrystal samples, creating the energy diagrams and a table of the resonant fields.
- Parameters:
Hamer (Class) – Container for the hamiltonian parameters of the system.
Expe (Class) – Container for the experimental conditions.
graph (Bool) – Plots the resulting spectrum and energy diagrams.
table (Bool) – Generates the resonant fields and transitions table.
relevance (float) – Relative threshold for the transition strength (Intensity/Boltzmann factor), if lower it is discarded. Default is 1e-4.
Mcolor (Bool) – Bool value to follow with colors the change in the expectation value for |mS| near anticrossings.
- Returns:
espac1 (np.array) – Array of the magnetic field.
inten1 (np.array) – Array of the counts of the spectrum.
Example
import matplotlib.pyplot as plt
import epraya as epr
import numpy as np
Ham,Exp,_=epr.Start()
Ham.S=1
Ham.I=1/2
Ham.g=np.array([2.003, 2, 2])
Ham.A=np.array([200, 200, 200])
Ham.Hpp=[0, 20]
Exp.Freq=9.4
Exp.Points=4096
Exp.Temperature=300
Exp.Frange=[0,800]
epr.Eresonant(Ham,Exp)