epraya.Splot#
- Splot(field, count)#
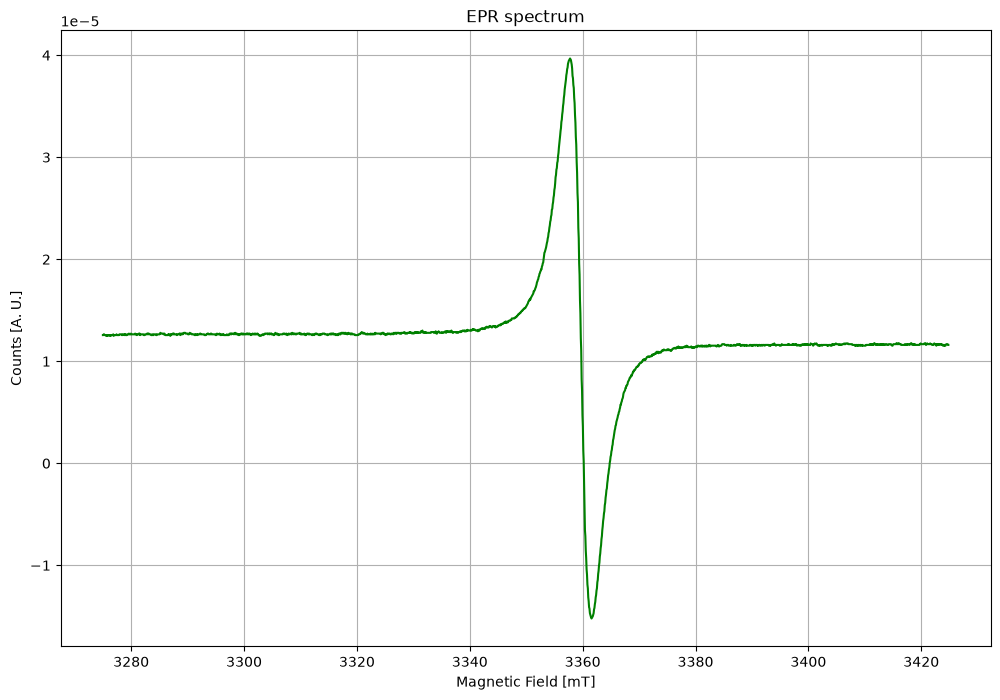
Plotting function for field and count data.
- Parameters:
field (np.array) – Array of the magnetic field values.
rcount (np.array) – Array of the counts values.
Example
import epraya as epr
import matplotlib.pyplot as plt
B,spc=epr.Sload('STRONG PITCH.dat',2046,[2,3])
epr.Splot(B,spc)