epraya.Voigtp#
- Voigtp(field, Int, rfield, Hpp, eta)#
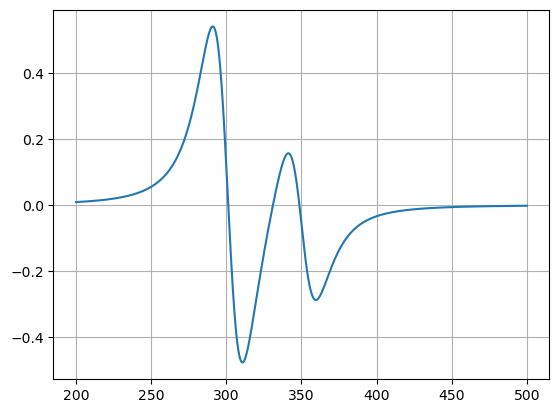
Determinates the voigtian profile of the spectrum as a lineal combination of gaussian and lorentzian profiles.
- Parameters:
field (np.array) – Array of the field values of the spectrum.
Int (np.array) – Array of the intensity calculated in the field values.
rfield (np.array) – List of the resonant fields of the system.
Hpp (list) – Peak to peak distance in mT, for gaussian and lorentzian profiles.
eta (float) – Percentage of the voigitan profile that corresponds to a lorentzian profile, from 0 to 1.
- Returns:
espec (np.array) – EPR spectrum
Example
import matplotlib.pyplot as plt
import epraya as epr
import numpy as np

Ham,Exp,_=epr.Start()
Ham.Hpp=np.array([10,20])
Ham.eta=0.5
Exp.Frange=[200,500]
Exp.Points=2000

fieldr=np.linspace(Exp.Frange[0],Exp.Frange[1],Exp.Points)
mu,sigma=350,50
rsonant=np.array([300,350,320])
inten=np.random.normal(mu,sigma,len(rsonant))

spc=epr.Voigtp(fieldr,inten,rsonant,Ham.Hpp,Ham.eta)
plt.plot(fieldr,spc)
plt.grid()
plt.show()