epraya.Spectre#
- Spectre(Hamer, Expe, Mcolor=True, phi=0, orient='Z')#
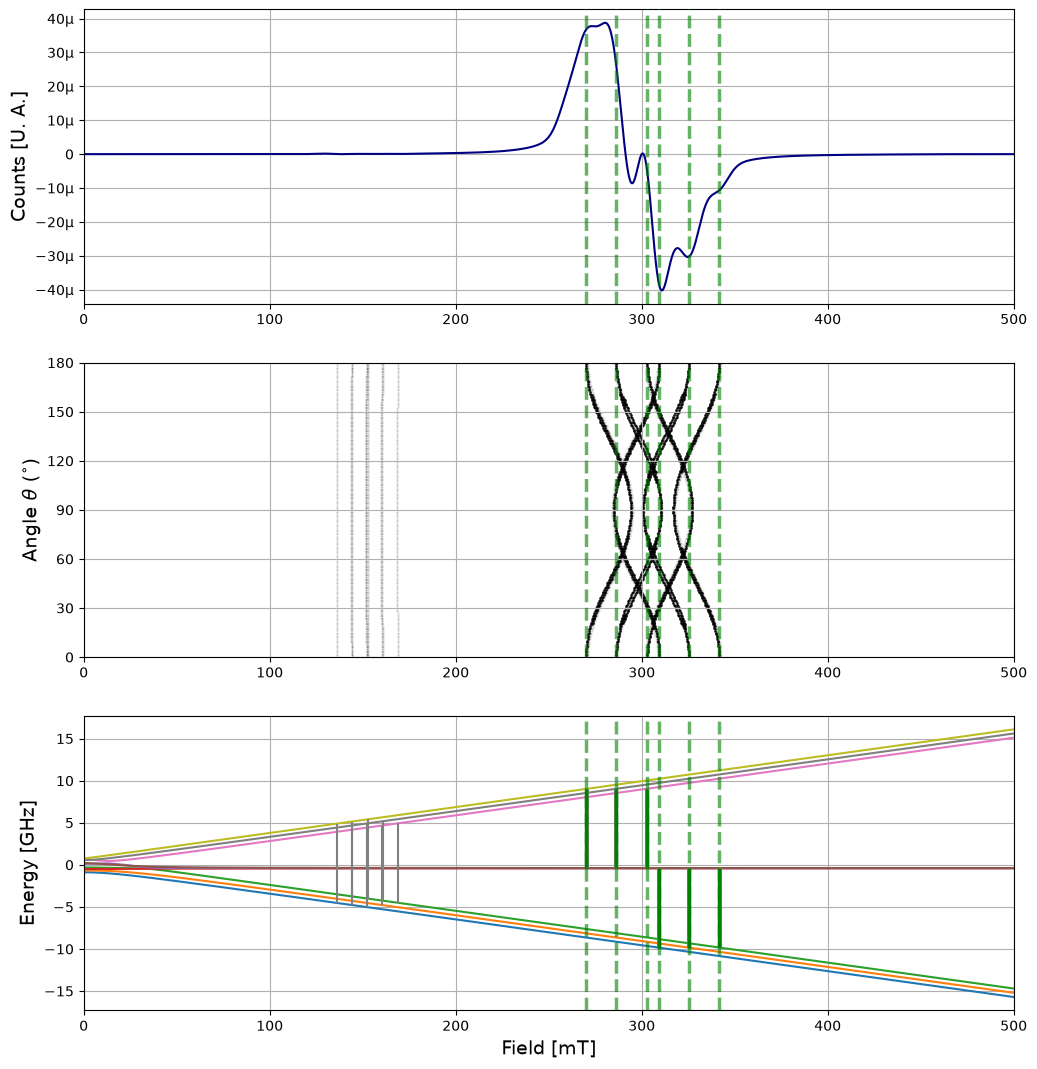
Plotting function for spectrum, energy diagram and angle variation. Three in one function for analysis of the resonant fields and their effects in the spectrum. Resonant fields are marked in the three plots with green lines.
- Parameters:
Hamer (Class) – Container for the hamiltonian parameters of the system.
Expe (Class) – Container for the experimental conditions.
phi (float) – Angle of inclination between the sample z axis and the lab z axis.
orient (str) – X, Y or Z orientation of the sample.
Mcolor (Bool) – Bool value to follow with colors the change in the expectation value for |mS| near anticrossings.
- Returns:
espac1 (np.array) – Array of the magnetic field.
espectotal (np.array) – Array of the counts of the spectrum.
Example
>>> import epraya as epr
>>> Ham,Exp,Vary=epr.Start()
>>> Ham.S=1
>>> Ham.I=1
>>> Ham.Hpp=[10,15]
>>> Ham.g=[2.2,2.4,2.2]
>>> Ham.A=[500,250,500]
>>> Ham.D=[600,100]
>>> Exp.Points=4096
>>> Exp.Frange=[0,500]
>>> epr.Spectre(Ham,Exp,phi=0)
(array([0.00000000e+00, 1.22100122e-01, 2.44200244e-01, ...,
4.99755800e+02, 4.99877900e+02, 5.00000000e+02], shape=(4096,)),
array([ 6.67524538e-11,  6.73816040e-11,  6.79981823e-11, ...,
-3.30499062e-21, -3.04059137e-21, -3.30499062e-21], shape=(4096,)))