epraya.Overseer#
- Overseer(field, counts, lt=51, pol=3, i=0, startl=0, endli=-1, epsilon=5 * 10**-6, plot=True)#
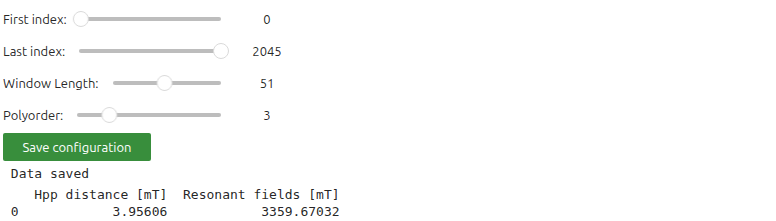
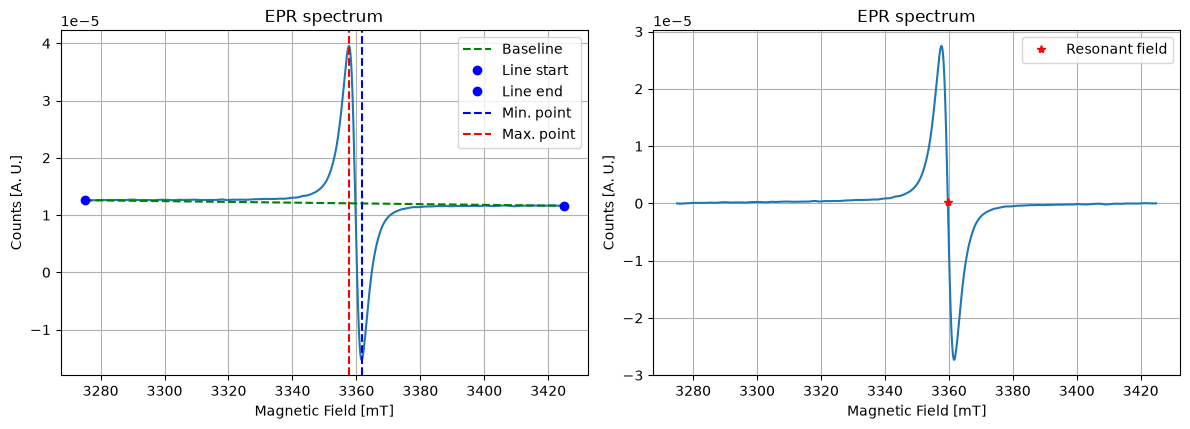
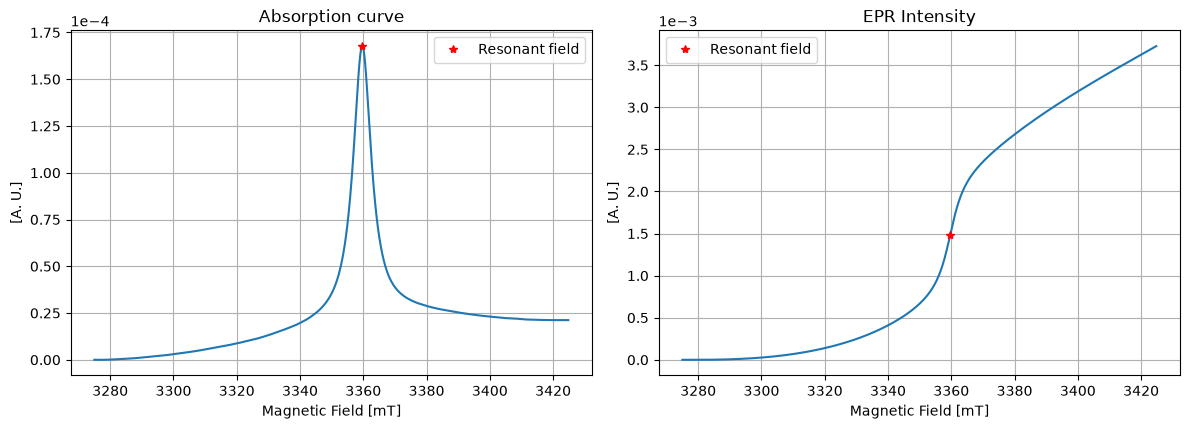
Interactive function for spectrum analysis of the experimental data, applying Savitzky-Golay filter to the data, finding it’s resonant fields, peak to peak distance and first and second integral.
- Parameters:
field (np.array) – Array of the magnetic field values.
count (np.array) – Array of the counts values.
lt (int) – Window length for the Savitzky-Golay filter.
pol (int) – Polynomial order for the Savitzky-Golay filter.
start (int) – Index of the first point to draw the base line.
endli (int) – Index of the last point to draw the base line.
epsilon (float) – Prominence value to mark the peaks in the plot.
plot (Bool) – If true, plots the graphs of the spectrum, filtred data and first and second integrals.
- Returns:
Sdata (Class) – Container of the saved values of peak to peak widths, resonant fields, filtred spectrum and the first integral.
Example
import epraya as epr
B,spc=epr.Sload('STRONG PITCH.dat',2046,[2,3])
Sdata=epr.Overseer(B,spc)
print(Sdata.Hpp)
print(Sdata.Rfields)
print(Sdata.spc)
print(Sdata.fintegral)
3.9560599999999795
[3359.67032]
[1.25966455e-05 1.25890390e-05 1.25820698e-05 ... 1.16215339e-05
1.16253103e-05 1.16295710e-05]
[0.00000000e+00 2.13932742e-09 3.77939041e-09 ... 2.12170265e-05
2.12165240e-05 2.12163506e-05]